
Sovereign Cycles
2026 is a New Business Cycle

Over the past year, I’ve documented the emergence of American Etatism—a system where the state exercises decisive control over economic life through fiscal dominance, monetary centrality, and executive discretion. As I wrote, this architecture in the U.S. “emerged through crisis response rather than ideological design, with each intervention expanding state capacity and creating dependencies that outlast the emergencies that justified them.” The 2008 financial crisis normalized massive government intervention. The COVID-19 pandemic demonstrated the state could replace entire sectors through direct spending. And now, through Treasury’s debt management strategy, regulatory coordination, and industrial subsidies, the government has positioned itself as the dominant allocator of capital in the American economy.
This shift has profound implications for how we understand business cycles. In traditional market economies, cycles emerge from the interaction of private credit expansion, capacity utilization, and monetary policy responses. But when the state controls liquidity provision through Treasury issuance strategy, directs capital via industrial policy, and maintains suppressed credit spreads through implicit backstops, the old playbook breaks down. The market indicators we’ve relied on for decades—ISM surveys, credit spreads, yield curves—are decoupling from asset prices because they measure private-sector dynamics in an economy increasingly dominated by public-sector decisions.
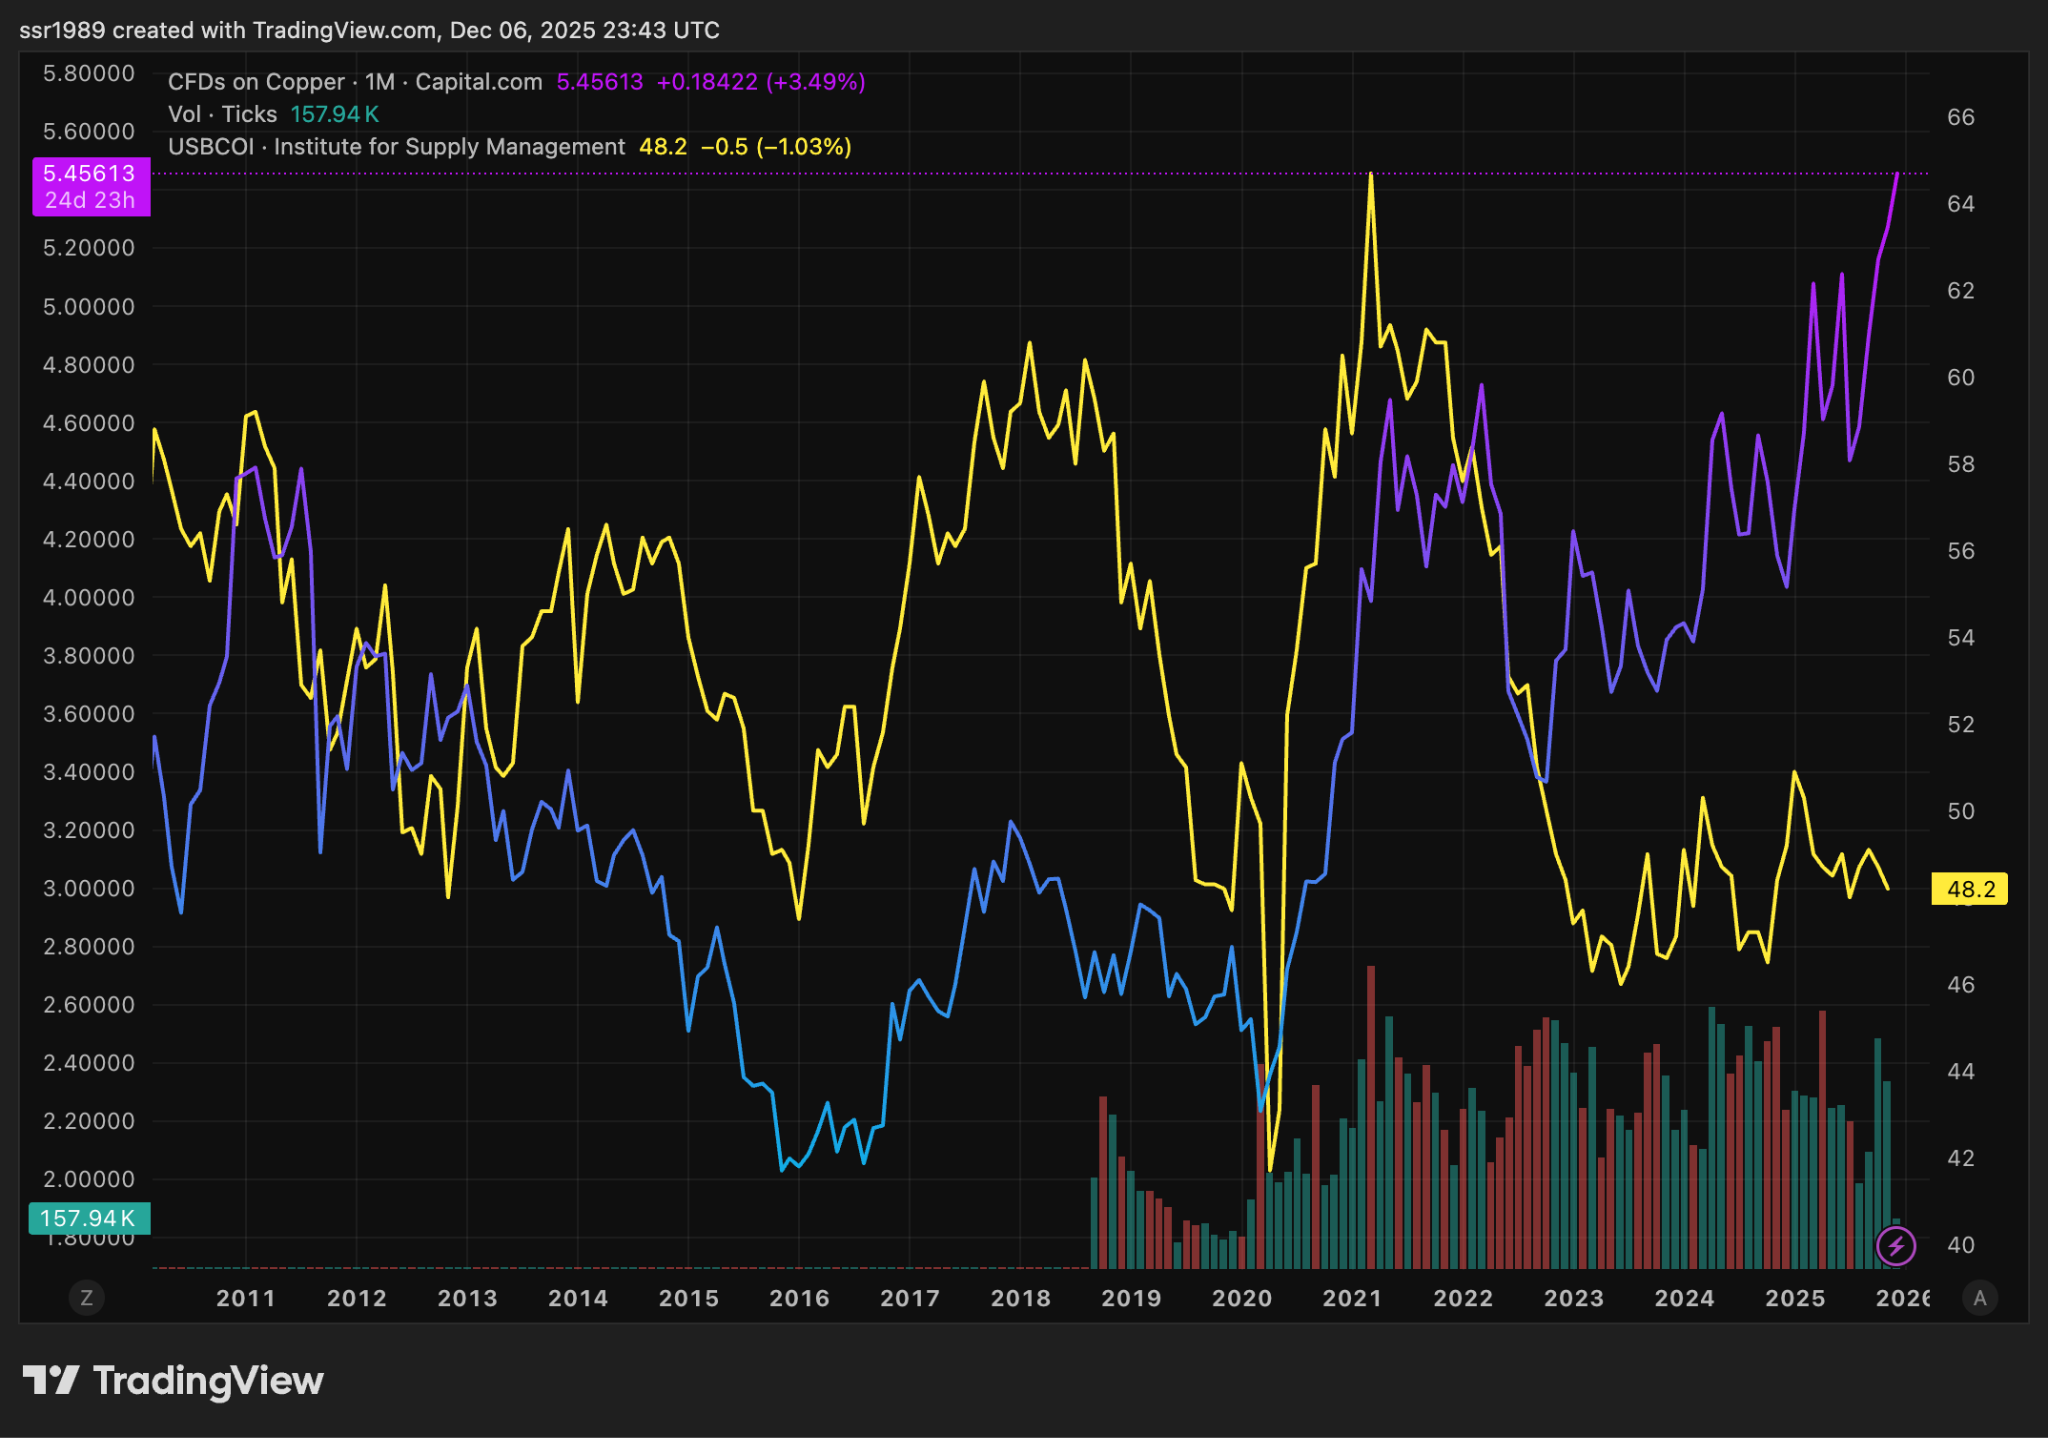
The argument I’d like to make in this piece is that we are actually done with the previous business cycle and are now beginning a new business cycle, it was just an extremely muted business cycle largely driven by the demand and supply shock of covid. The first chart I want to discuss is the ISM PMI. PMI since Q4 2022 has fallen below 47 on multiple occasions. That hasn’t happened in the economy since 2008 outside of 2020 which was an extraneous event.
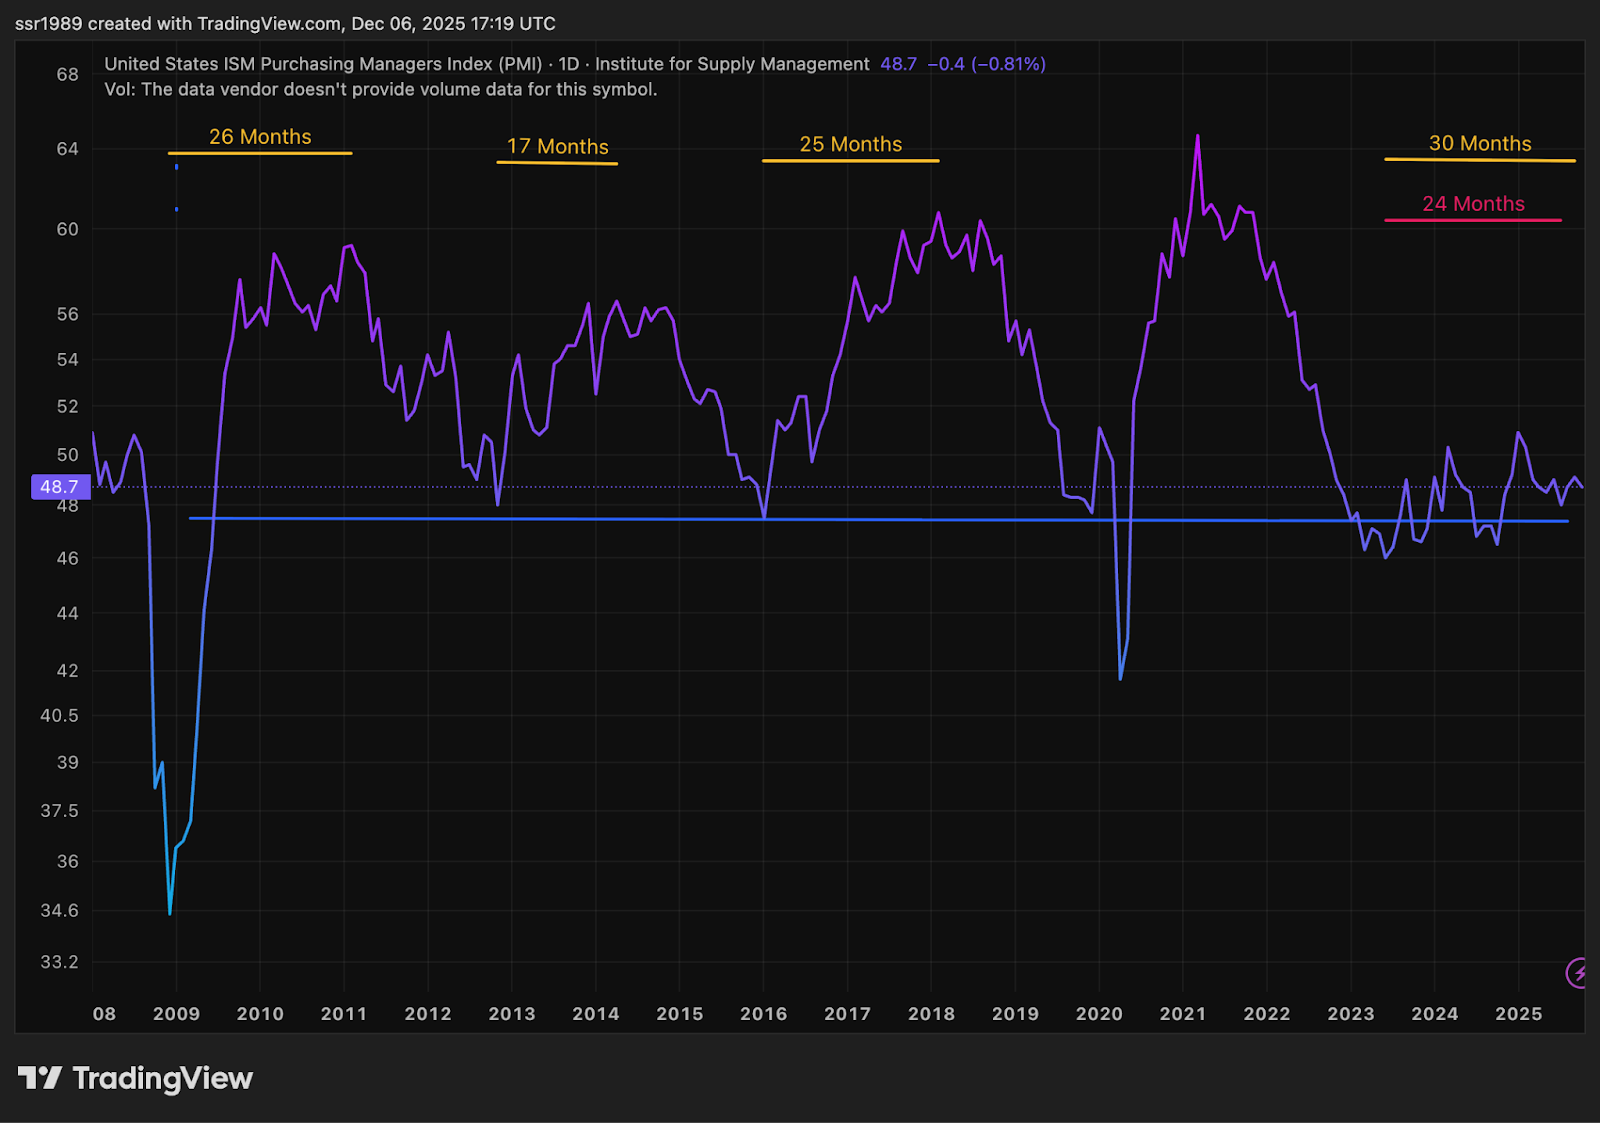
Also, since 2008, from the bottom to the peak in ISM, it has usually taken anywhere between 17 to 26 months, leaving out the 2020 cycle. If we were to assume that it is the same cycle, then it has been going on for 30 months. At some point you have to stop looking at charts and really question what does it mean to have a business cycle? No one really knows how long the business cycle is. But that’s precisely the point. ISM remaining depressed for 30 months—far longer than any post-2008 cycle—proves markets have structurally decoupled from traditional manufacturing activity. This isn’t a delayed recovery; it’s a structural break. The indicators that signaled cyclical turns for decades are now measuring an economy that no longer exists—one where private credit cycles, capacity constraints, and inventory dynamics drove expansions and contractions. In the étatist economy, these dynamics are subordinated to state priorities. Manufacturing activity as measured by ISM can stay suppressed while copper prices surge (more on that later), because the state is directing capital into strategic buildouts that won’t show up in purchasing manager surveys until facilities come online years from now.
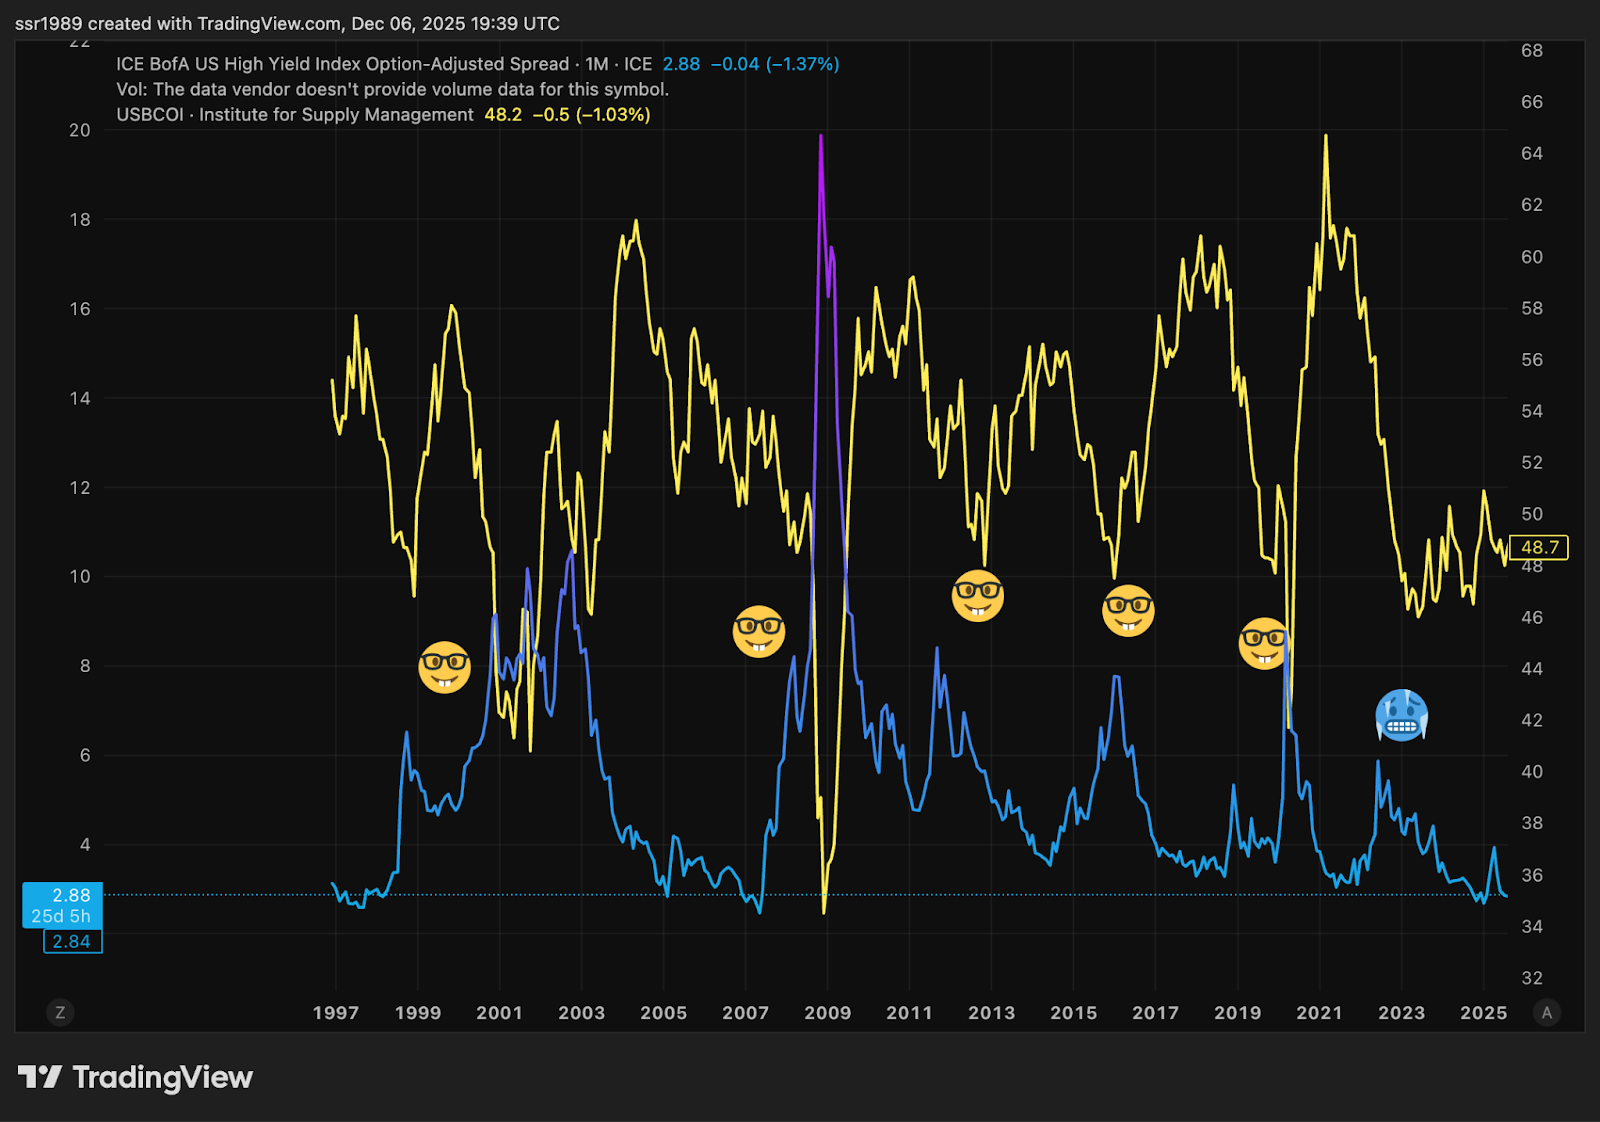
Then if we turn our attention to ISM and junk credit spreads we see that going back into the 90s, every time the ISM bottoms, the junk credit spread spikes. There are two things to note here:
The overall trend of the credit spreads is towards suppression. So when people talk about credit spreads being suppressed as a late cycle indicator, they are simply not paying attention to the larger etatiste story. It’s really the markets saying that given the amount of bond issuance, the junk credit isn’t all that risky compared to government bonds. As such credit suppression is losing a lot of it’s value in predicting cyclical turns.
Not only is the spike in 2022 credit spread far muted, you compare it against the ISM falling in 2023 and 2024 below 47, and you see literally no spike.
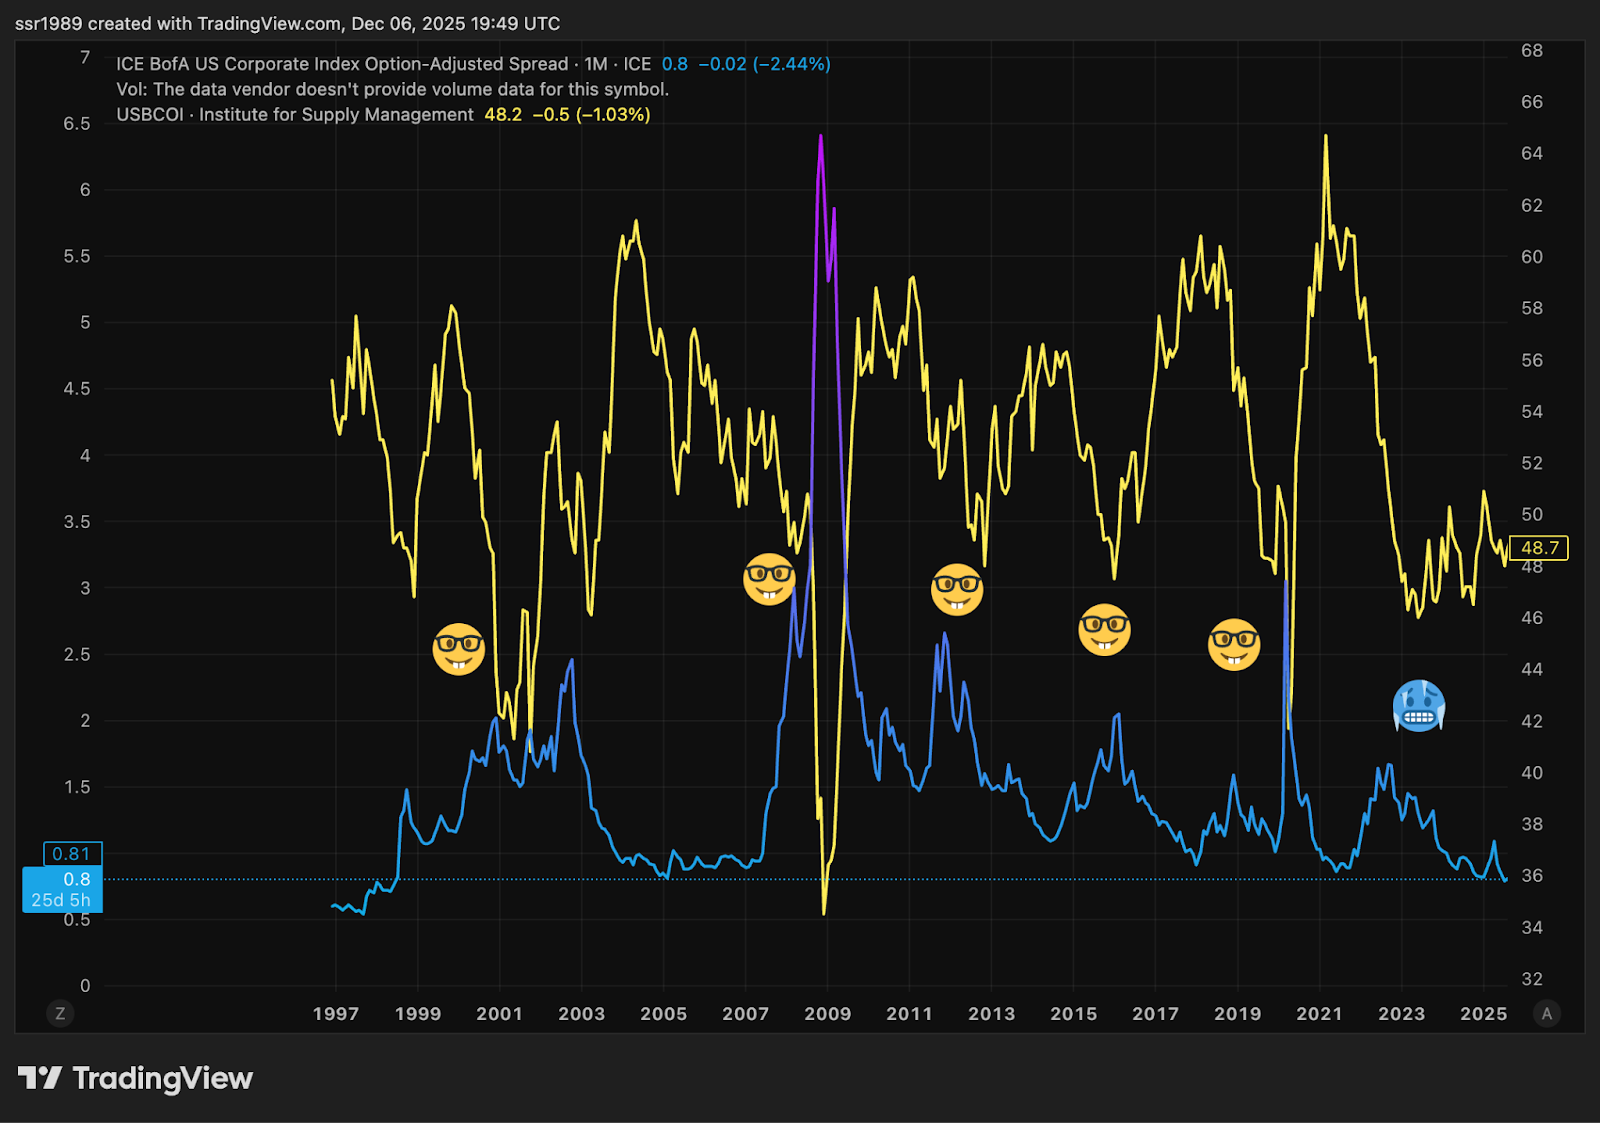
The same story in investment grade corporate credit spreads.
Of course, this arrangement holds only as long as the government maintains both the capacity and willingness to provide implicit support. The risk isn’t that spreads are “wrong” today—markets are correctly pricing in étatist backstops—but that the regime itself proves unsustainable over the medium to long term. Annual interest expense on the federal debt now exceeds $1.1 trillion, constraining fiscal space even as deficits remain near $2 trillion. Political consensus can shift, particularly if Democrats win the house in 2026 or if the Fed is forced into tightening what Treasury’s bill-heavy issuance strategy cannot fully offset. And international creditors, facing their own fiscal pressures from Trump’s capital extraction, may prove less willing to absorb Treasury paper at current yields. The suppression is real, but it’s a policy choice that requires continuous renewal. Credit markets are pricing in the toys staying with the state. The question is whether that remains politically and fiscally viable through the entirety of this new cycle.
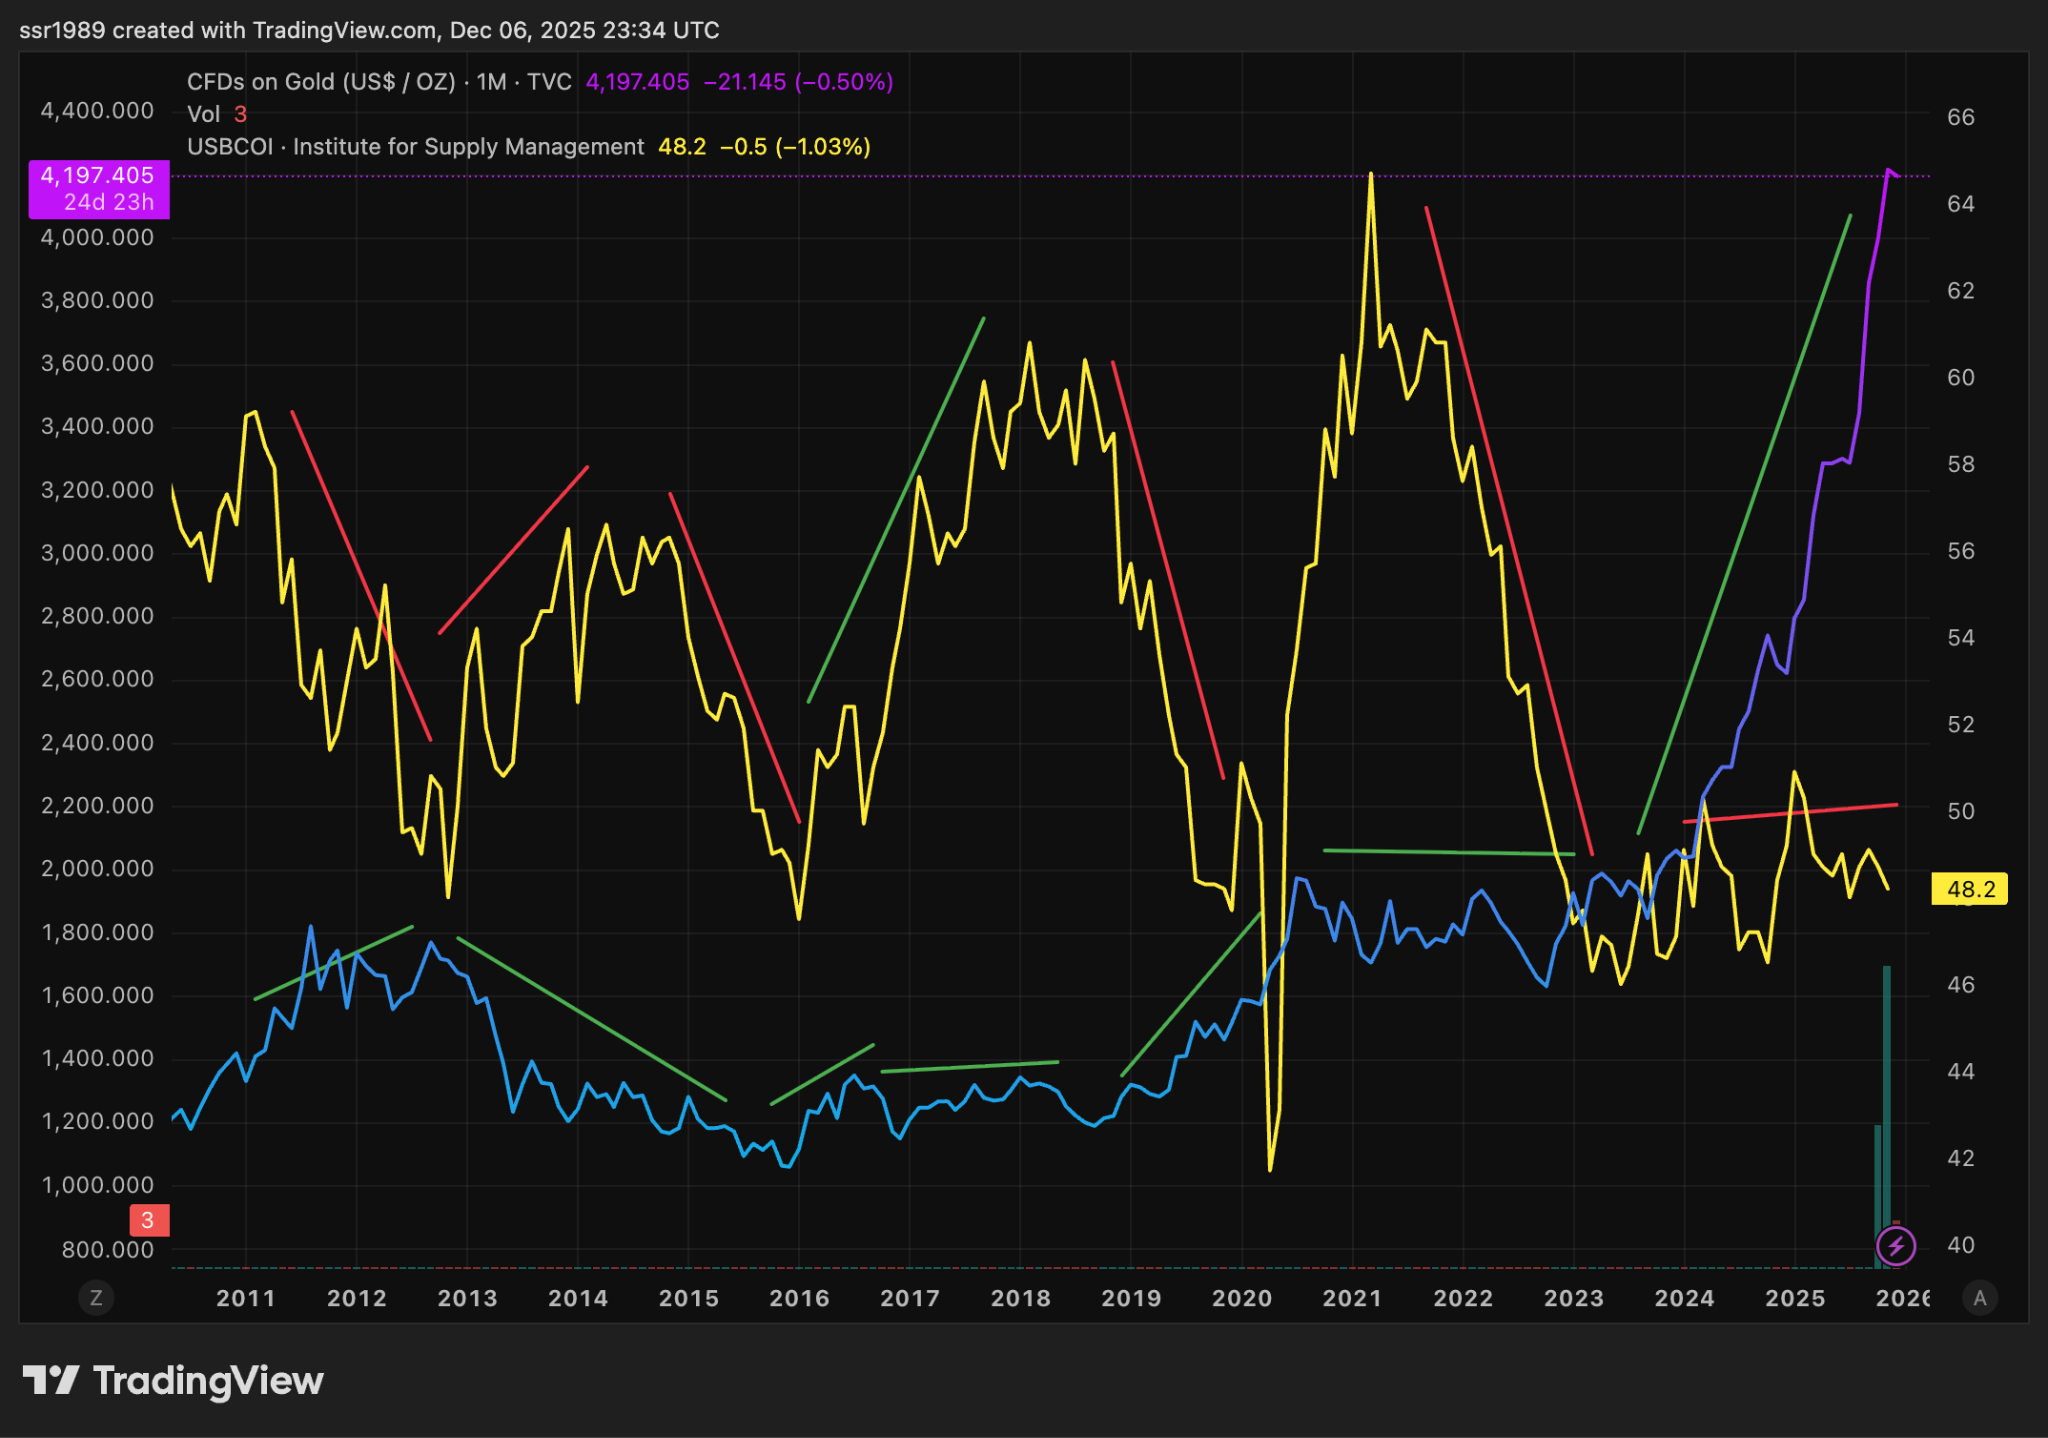
Anyway, back to Dec 2015 — why has ISM stayed so suppressed? Because of Gold. Gold, instead of being a de-dolarization trade, is a risk-off trade. The chart below shows an imperfect relationship. Usually when ISM is rising, gold falls off and when ISM is falling, gold rises. Because rising ISM is risk-on with economic momentum and rising gold is not. But not always. Like between 2014 and 2019, gold completely broke off with the ISM. ISM fell, rose, and fell again but gold did not do much. Then again between 2021 and mid 2023 where ISM fell and gold did not do much (also why Gold is not an inflation hedge). But now ISM has largely stayed flat but gold has done a hockey stick. We’ll get back to gold but for now it’s important to see that Gold is screaming risk off and credit spreads are screaming relative risk is disappearing. The risk curve is fast becoming discreet instead of continuous. Because we’re in an etatiste paradigm where economies and risk rise and fall with government backing.
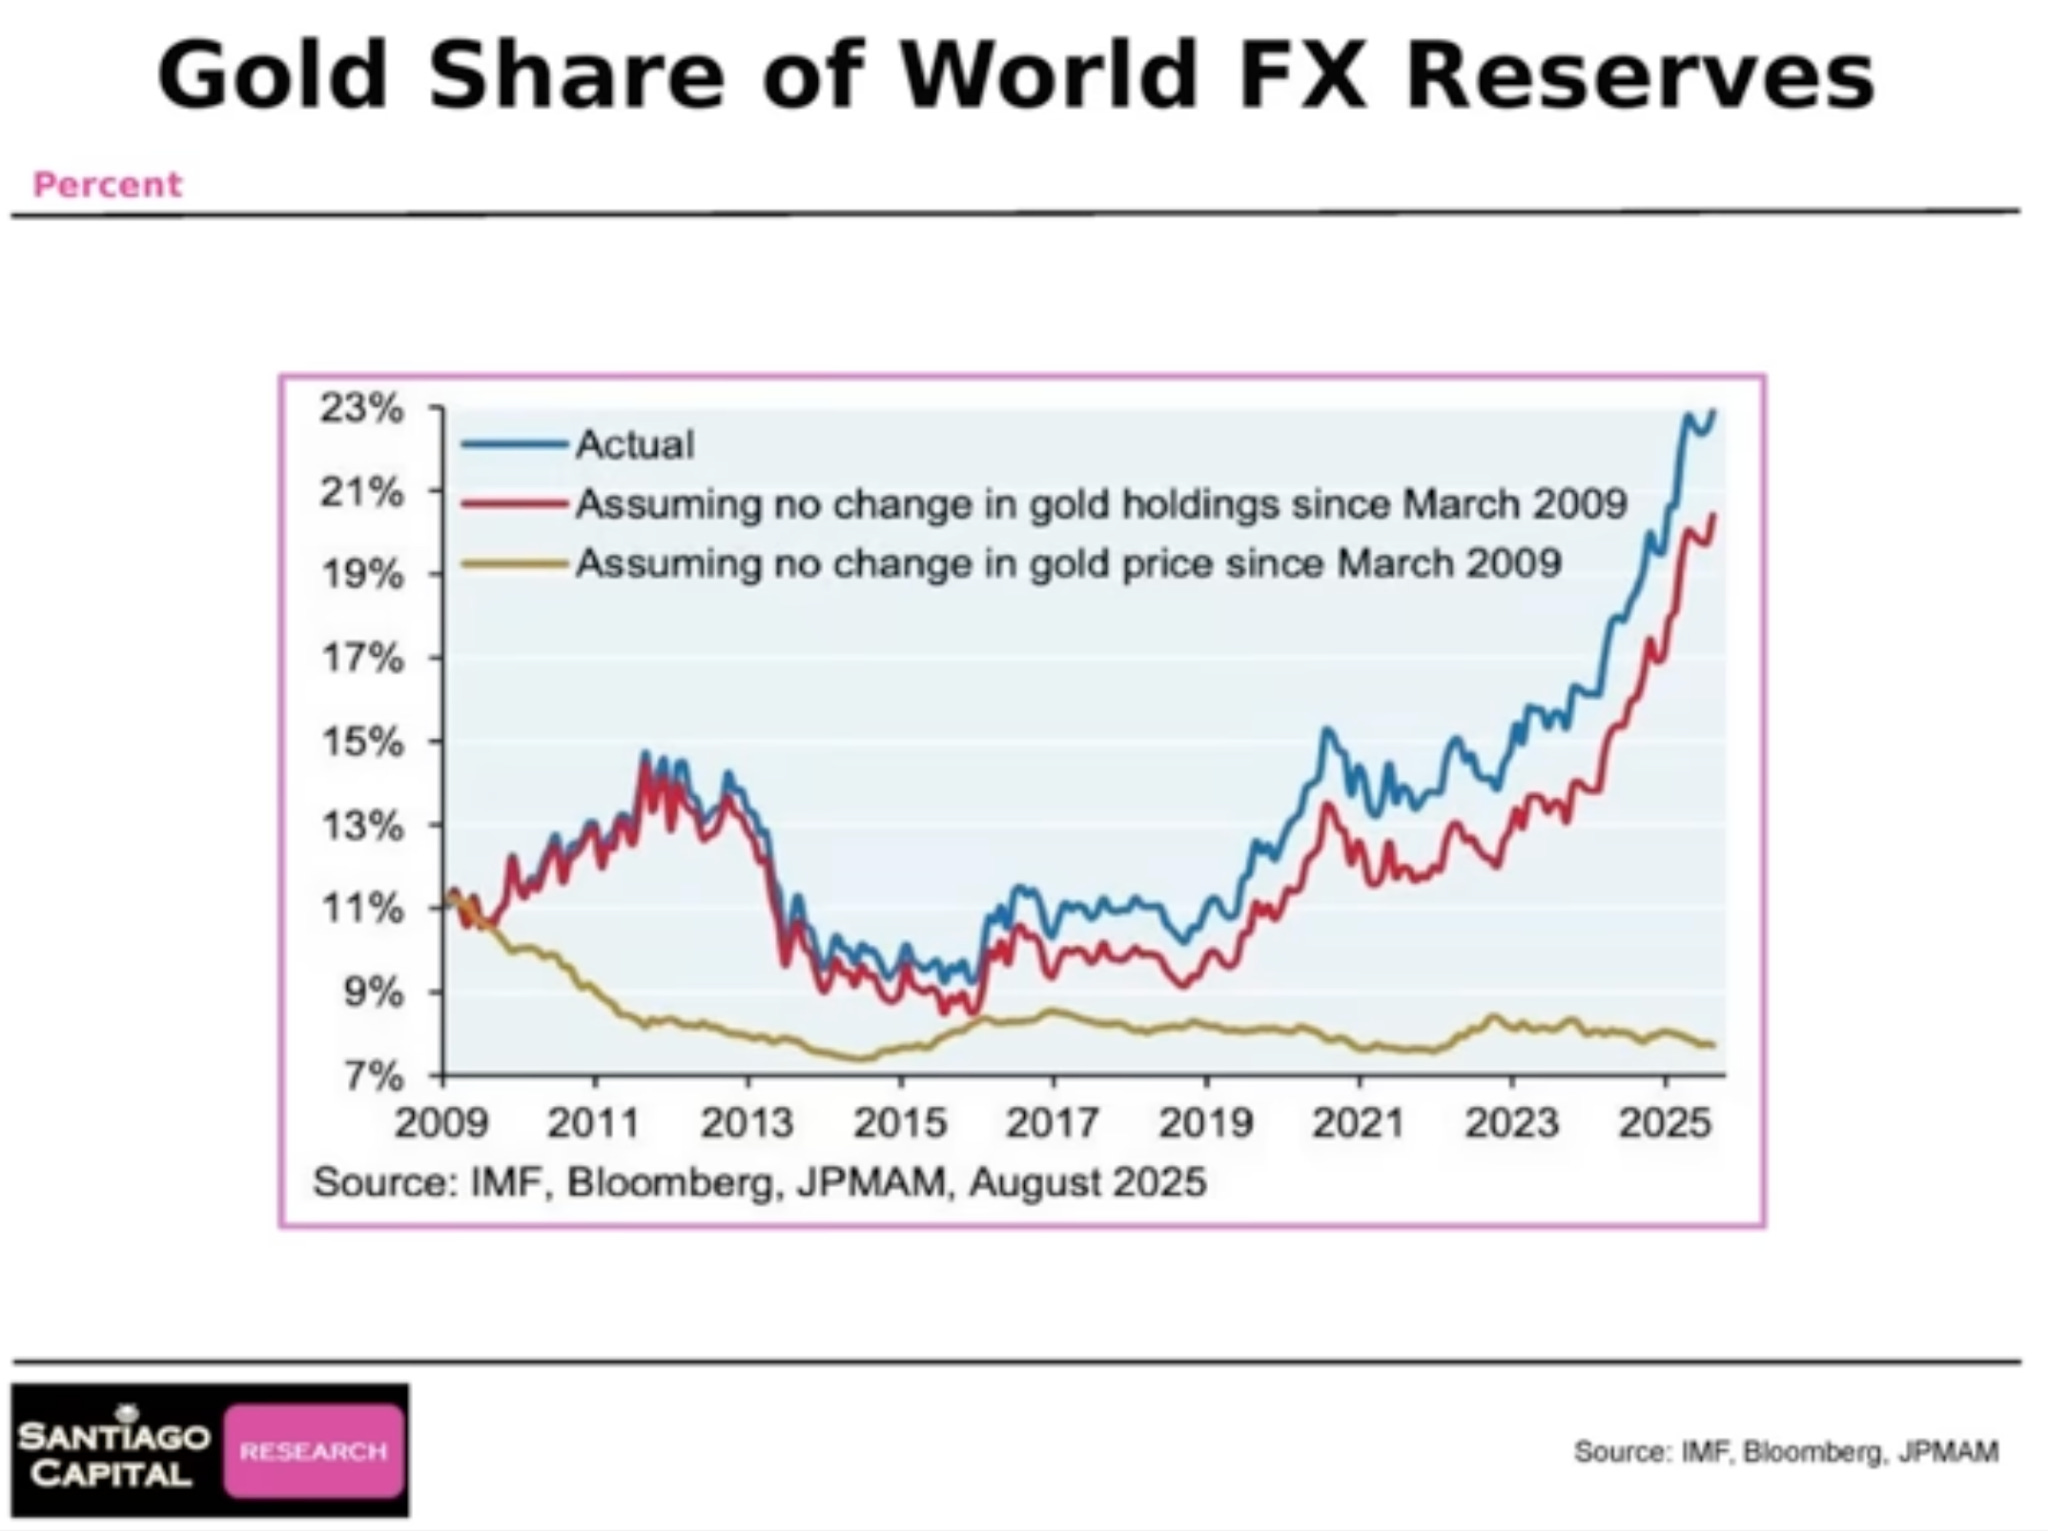
Also, contrary to popular opinion, the central banks have not added much gold. Gold is being bought by the free market. This is a chart I stole from Santiago Capital. As I said, it’s not a de-dollarization trade. It’s a risk-off trade driven by free markets.
The other important thing to note here is that even if the long term trend of credit spread suppression continued, as the ISM bottomed in 2023 and credit spreads started falling again, we should have see the ISM spike like in previous years.
Instead, it stayed muted. So market continued to buy junk and corporate credit like it should as ISM bottomed but the ISM never picked up. That’s telling us something - that risk is being readjusted. Markets are already pricing in Etatism. Not just in AI and big tech but even in junk. The government is completely in control.
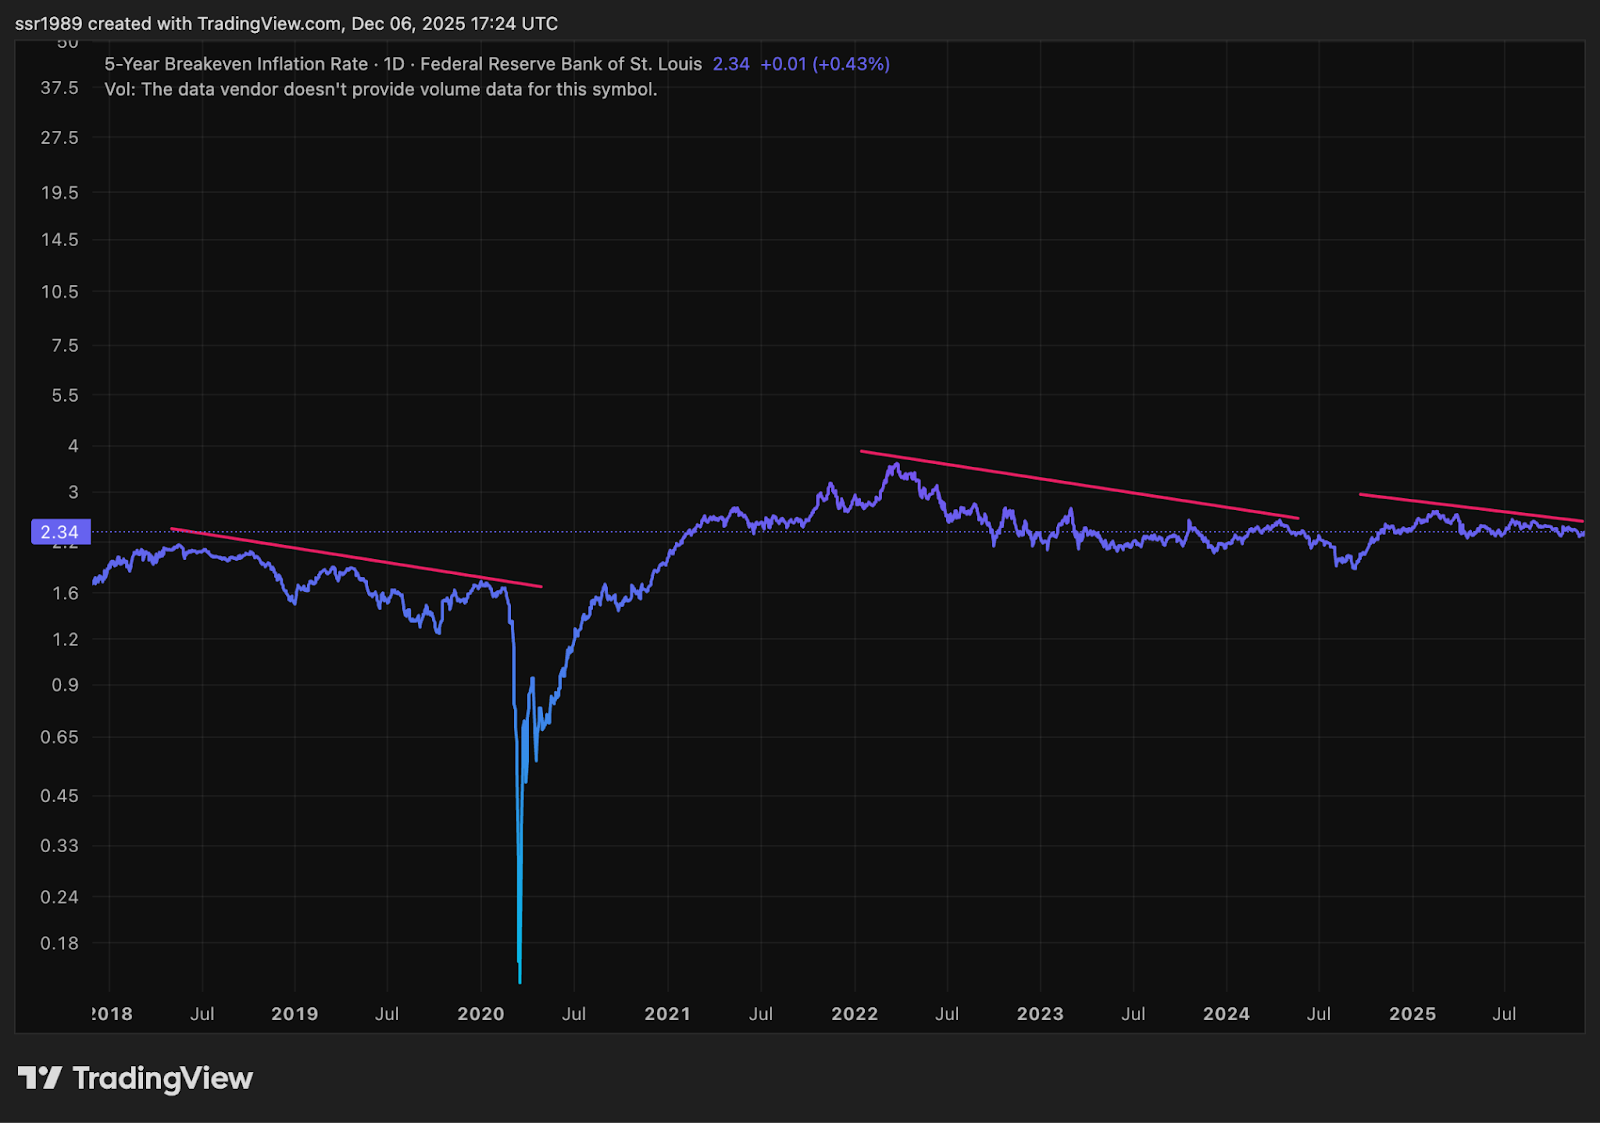
Some might say that it’s not that junk is less risky, it’s that sovereign debt is more risky and government bonds are pricing in higher inflation. Hardly. Look at the 5-year breakevens. It’s flat to down. The market does not think that inflation is a real risk. The market is worried about real economic deflation and is interested in holding real assets.
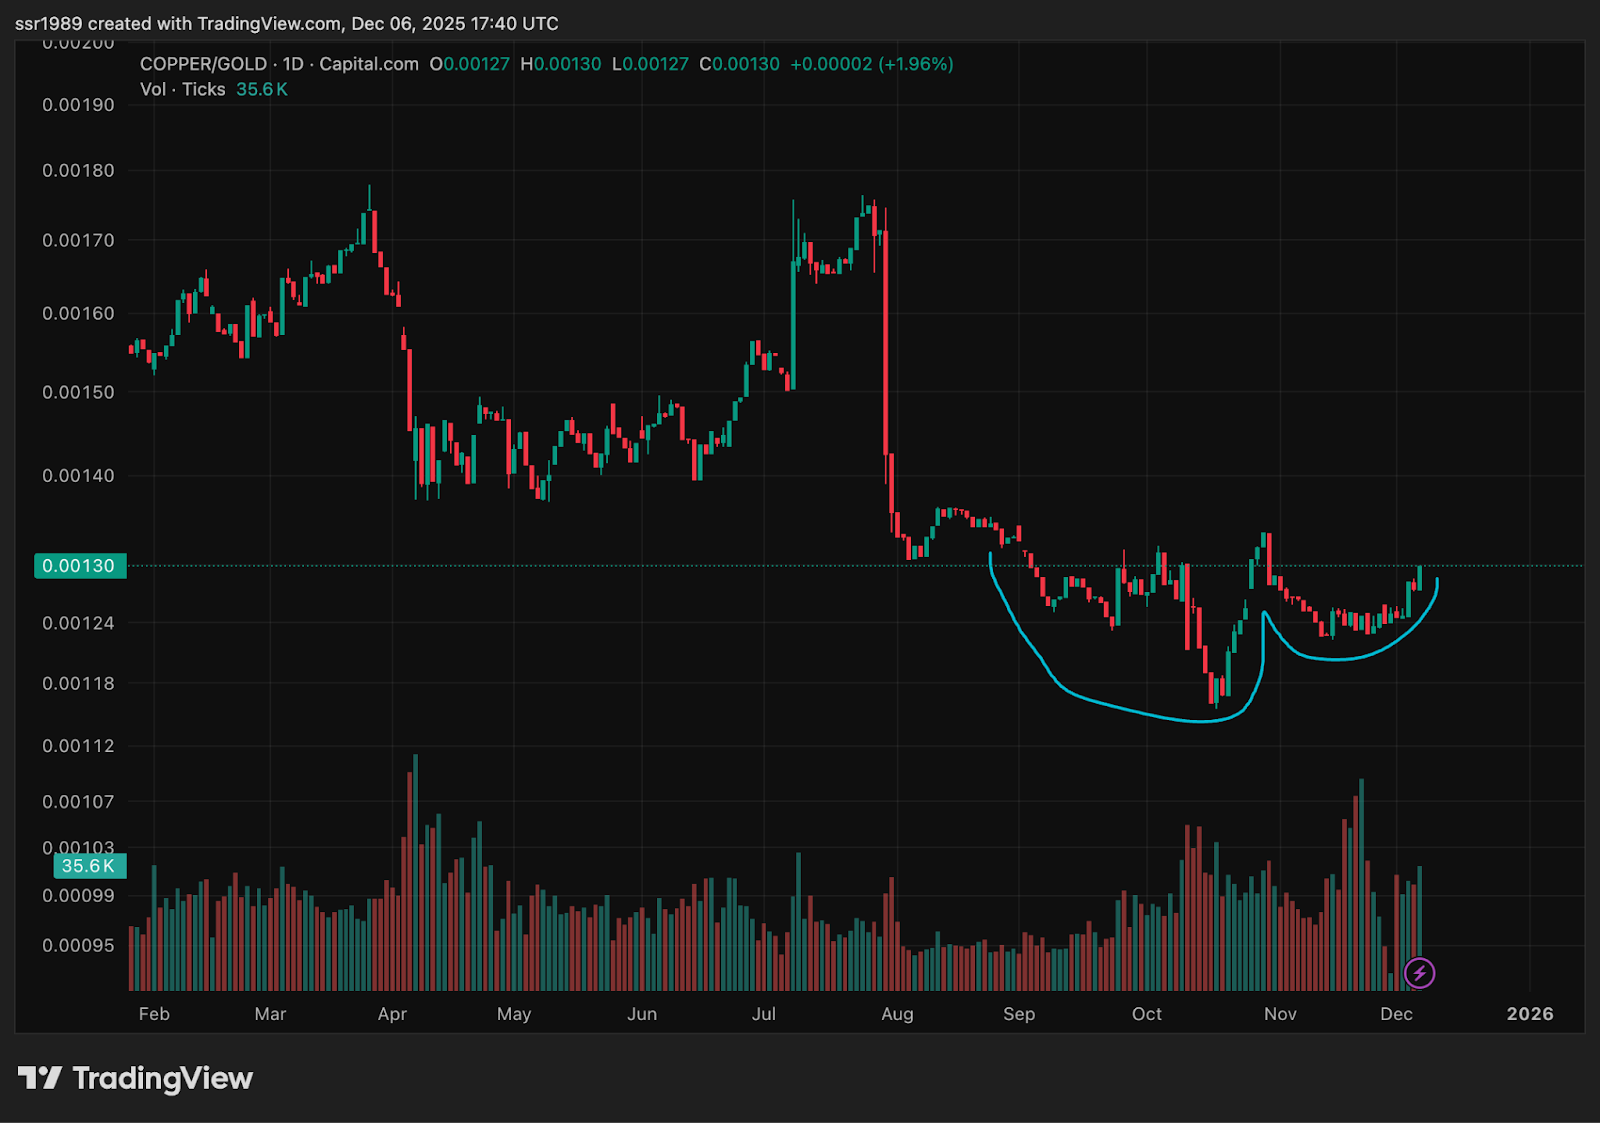
So what’s happening with the real economy? Let’s look at copper to gold ratio. First off, when copper to gold is dropping off like this - the first instinct is that this is bad and risk-off because copper is an industrial metal and gold is largely a useless metal meant for ornaments.
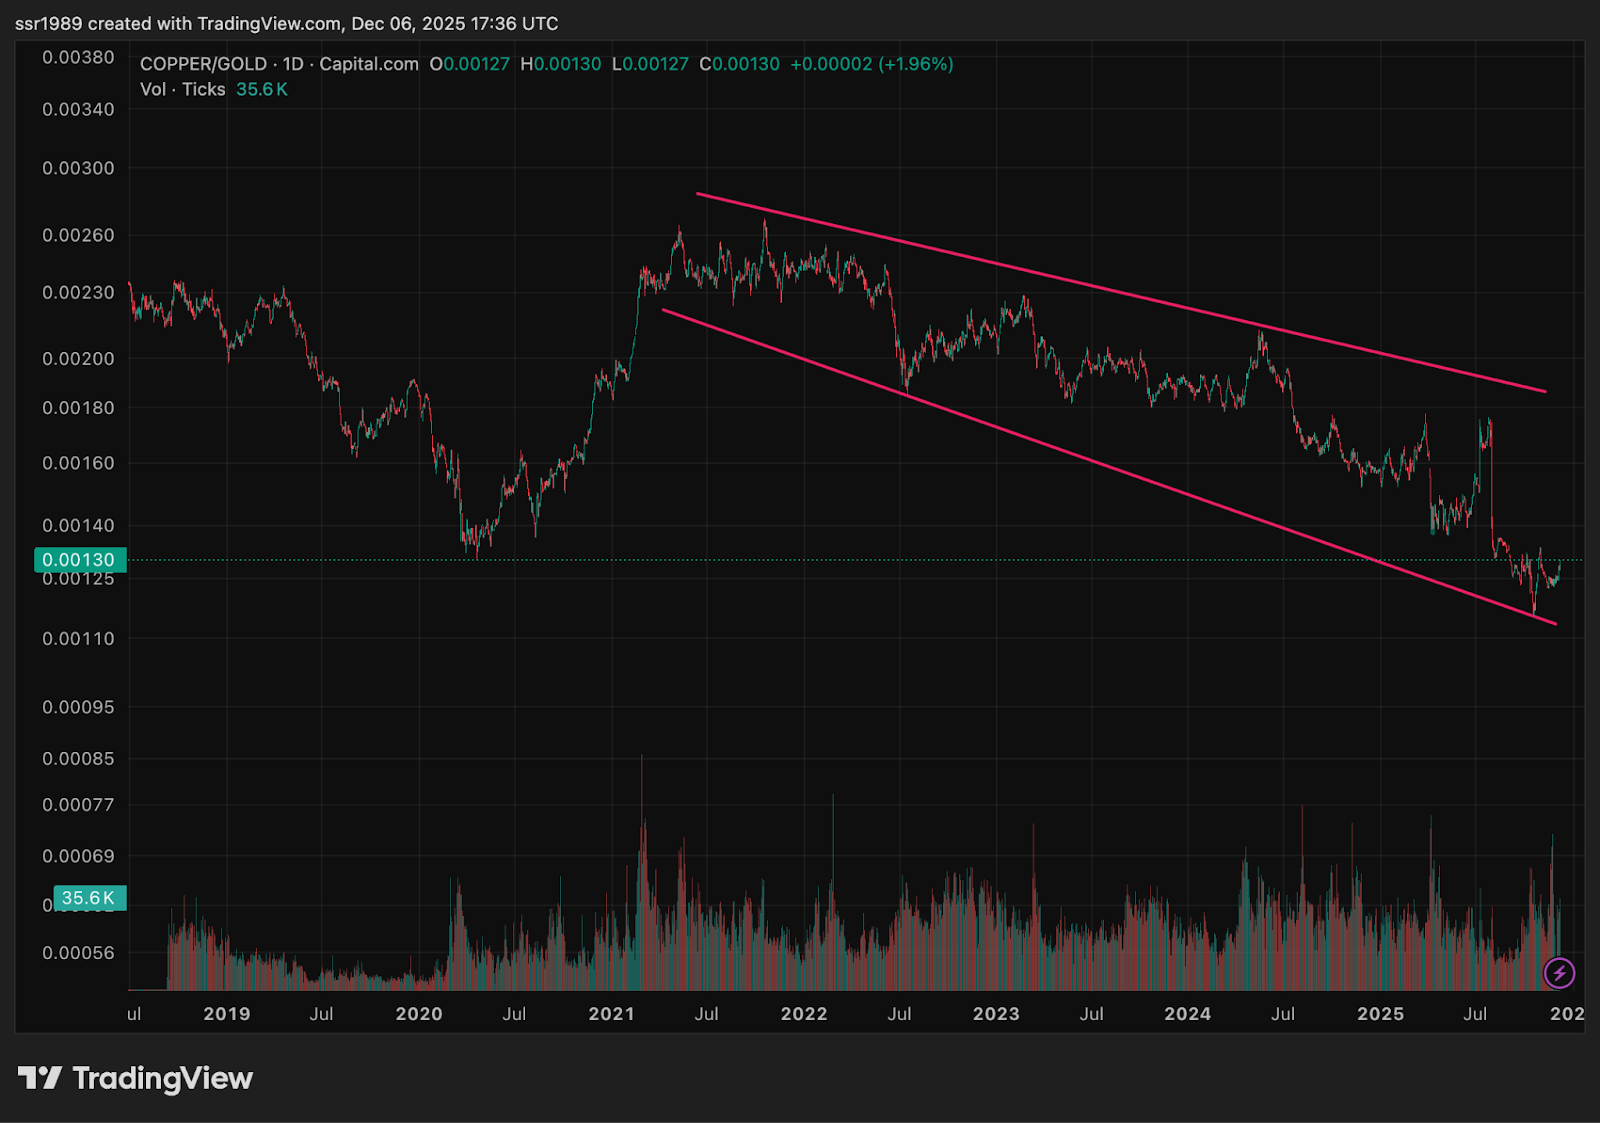
But is it risk off? Copper prices, themselves, are rising. The chart below is the most important chart in this piece. If the economy is doing so badly, why has copper gone up without an uptick in ISM? ISM rising without a huge rise in copper prices is understandable—plentiful supply of copper should help productivity. But the flip side is not true. There are no supply squeezes on copper currently. Copper prices can only go up on demand. So if copper demand is through the roof, why don’t we see it in the ISM?
This should tell you that we are in a different regime. Copper prices are going up because we are in a geo-political race for manufacturing in a fractionalized world. This should continue for the better part of the next decade and governments all over the world are pouring resources to secure their economies. The timing matters. The CHIPS and Science Act allocated $52.7 billion in manufacturing subsidies and $24 billion in tax credits, with funds beginning to flow in Q4 2023. The Inflation Reduction Act’s clean energy tax credits kicked in throughout 2024. But semiconductor fabs take 3-4 years to build, battery factories 2-3 years, and advanced manufacturing facilities similarly long lead times. We’re currently in the capital deployment phase—copper gets purchased for electrical systems, specialized equipment gets installed, construction workers get hired. The ISM won’t capture this as “manufacturing activity” because nothing is being produced yet. These facilities are under construction, not operating at capacity. The inflection happens in 2026-2027 as these projects come online and begin actual production. That’s when ISM surveys will finally reflect what copper markets have been pricing for two years—a massive industrial buildout directed by state policy. This is why 2026 marks the beginning of the new cycle.
If my etatism thesis is correct, the government will move into the second phase of managing the economy, i.e., incentivizing consumption for what is being produced. Trump’s $2K checks will do the trick. And of course, the markets can sense that. Going back to copper to gold, it’s forming a nice cup and handle. This is not late cycle behavior. This is early cycle behavior. The previous cycle is over and 2026 is a new business cycle.
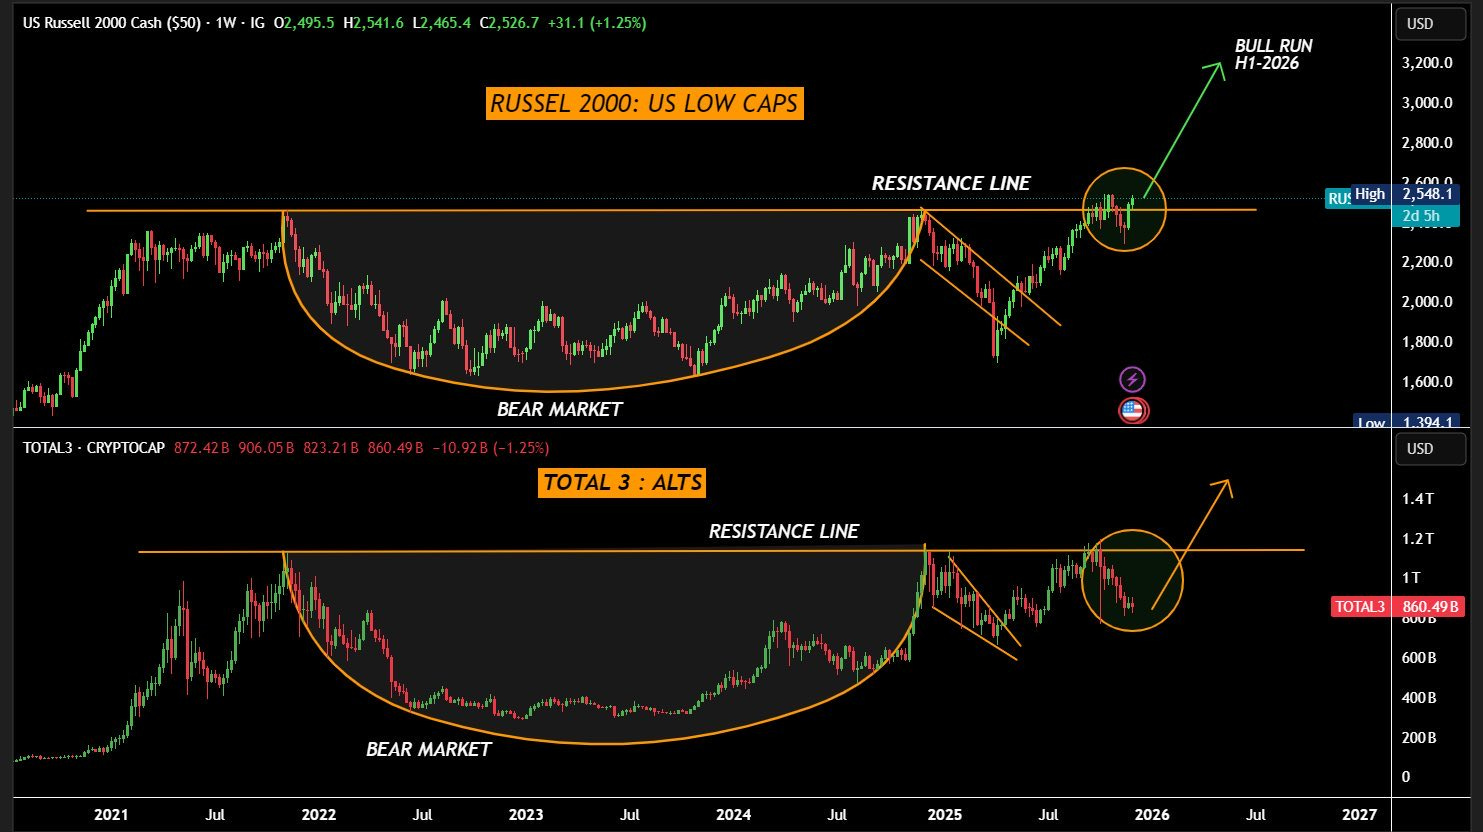
And it’s not just Copper to Gold. It’s Russell 2000 as well. Small caps rise as risk returns in early cycles. In crypto, we call it the alt season.
This is still early and given geo-politics, the next cycle could be muted as well. But if I am wrong, I’ll know I have been wrong consistently. Little solace, but I have at least been right till now in calling the top in gold on Oct 18 and when the markets crashed, I was busy buying alts.
One final chart: US10Y. To come full circle to credit spreads, our usual understanding is that if credit spreads are suppressed, that’s late cycle behavior. But the trend is clear in credit spreads - they will stay suppressed. But if the government is in the driver’s seat, US10Y will move down along with junk bonds and corporate credit. The US10Y is in a clear downward trend making lower lows and lower highs.
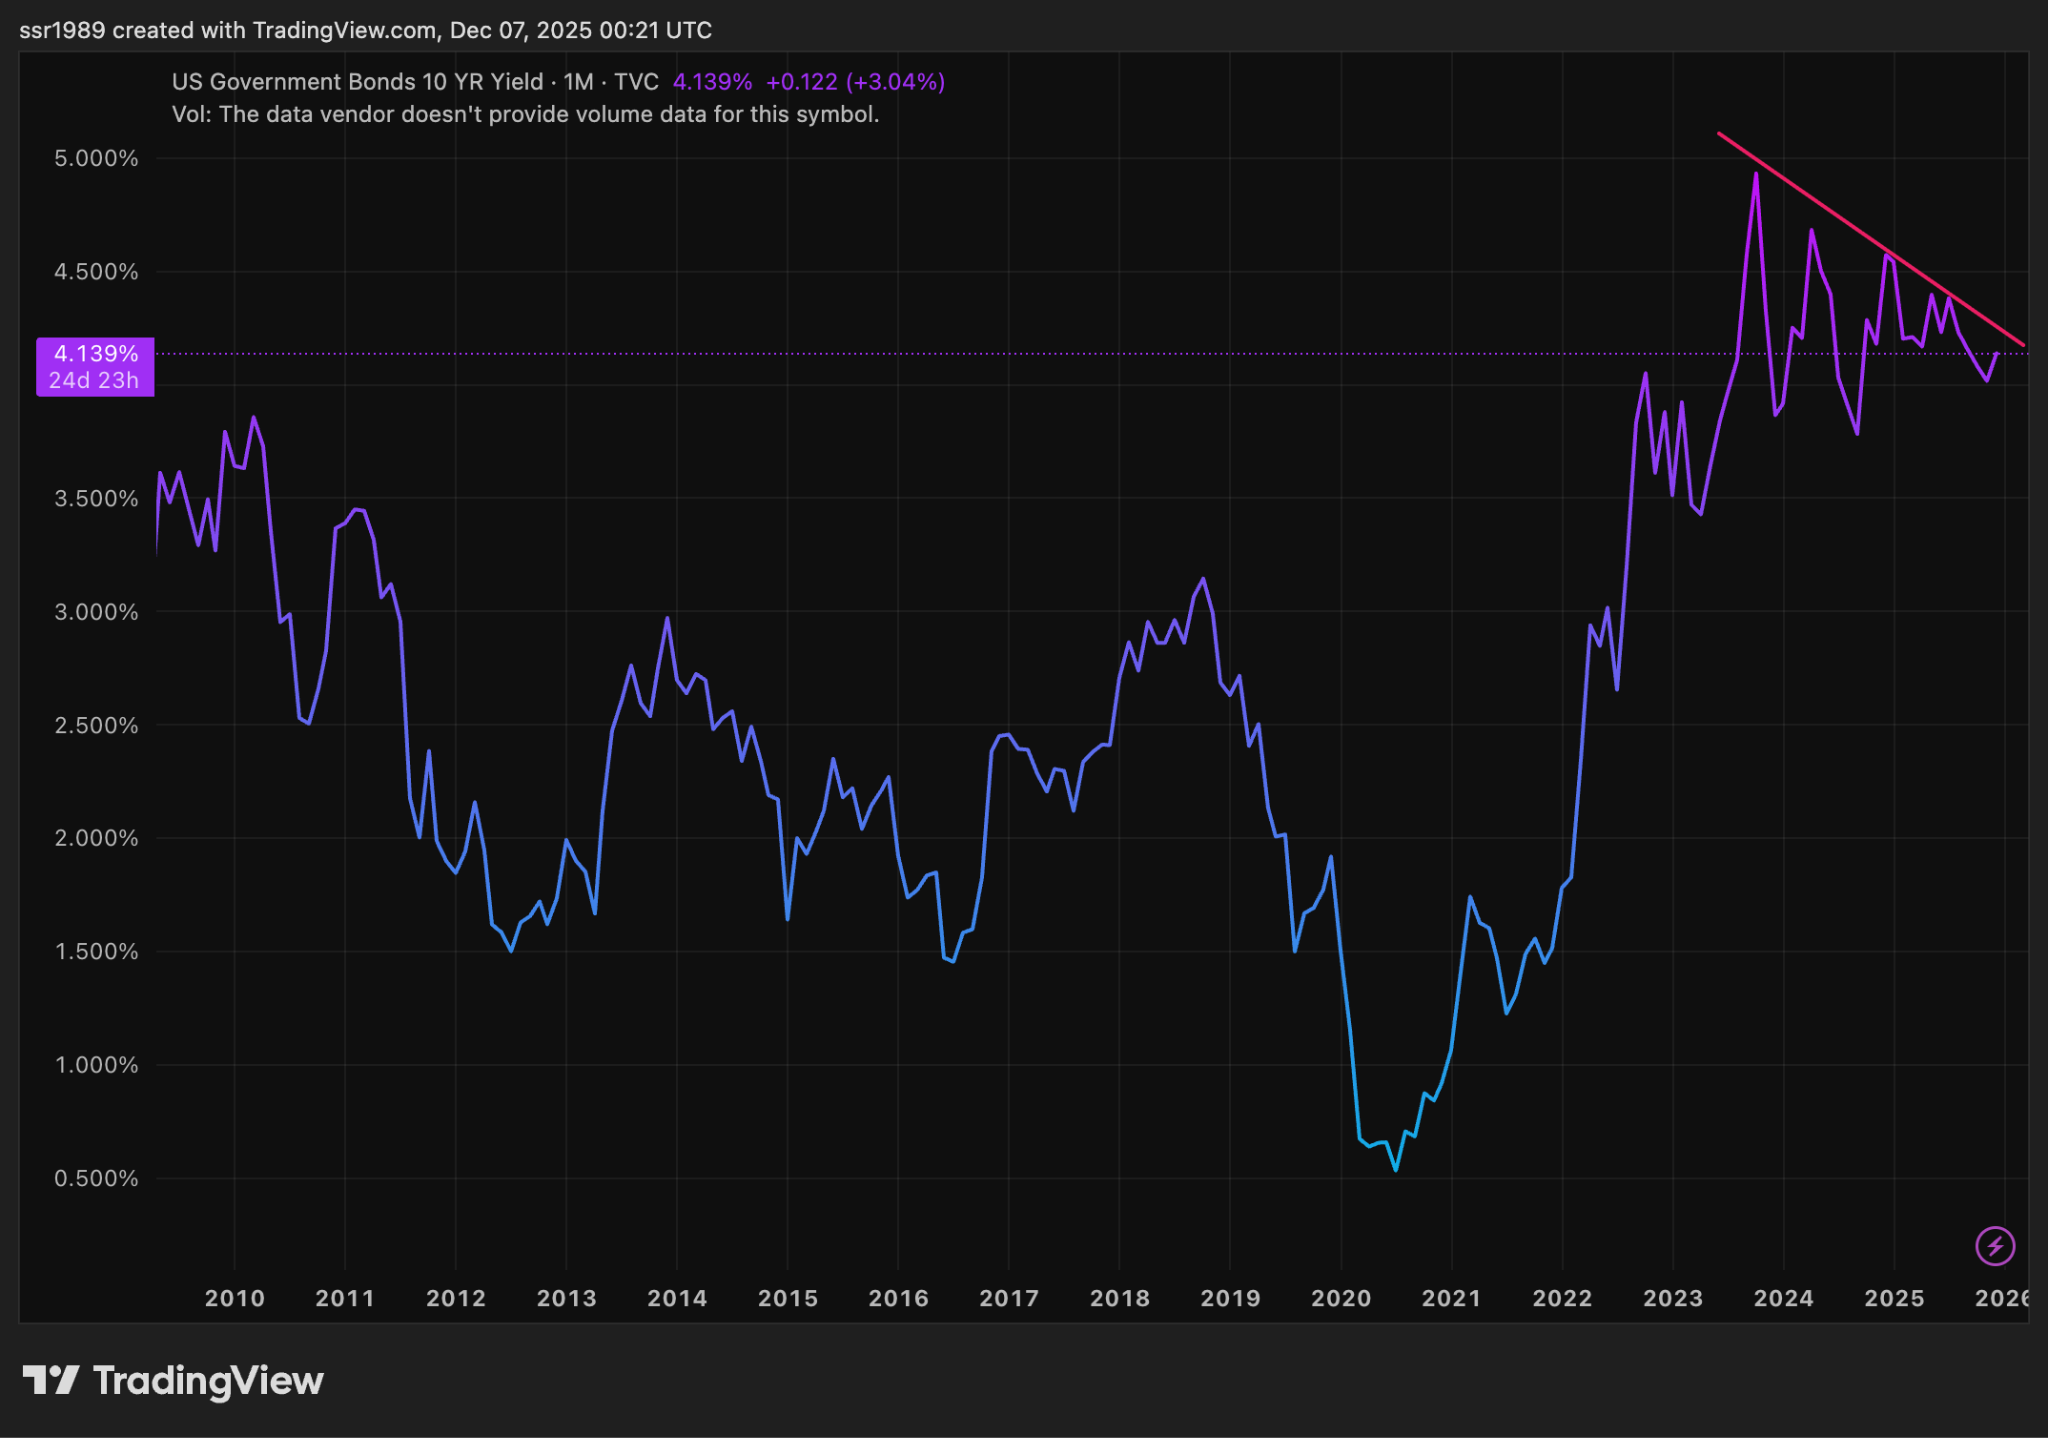
How does the government manage this massive refinancing without blowing out yields? As I detailed in Treasury Dominance, “Treasury has responded by keeping long-end coupon issuance flat while expanding bill supply.” Treasury bills now represent over 21% of outstanding marketable debt, up from 15% in 2021. This isn’t passive debt management—it’s active liquidity control. By concentrating issuance at the front end where money-market funds (now exceeding $7.5 trillion) and stablecoins provide structural demand, Treasury compresses term premium at the long end. The November 2025 quarterly refunding statement explicitly noted Treasury would keep coupon auction sizes “regular and predictable” while using bills as the “shock absorber” for borrowing fluctuations. Meanwhile, the Fed’s November 2025 modifications to the supplementary leverage ratio freed up bank capacity to absorb an estimated $3-4 trillion in additional Treasuries and reserves. As I wrote, “the state is moving to ensure not only that banks can hold Treasuries, but that the opportunity cost of not doing so is minimized.” The ten-year yield isn’t falling despite massive supply—it’s falling because of how that supply is being managed. And if you’ve followed the rise of Etatism on this substack, you’ll know it’s not just the 10-year that is being managed.
Help me reach 100 subscribers so I can help more folks navigate Etatism.
